Filters
IronFlock lets you filter data across multiple widgets at once, giving users powerful control over what they see — all without any backend coding. Add filter widgets to your board and every chart, table, map, or gauge connected to that filter updates instantly when a user makes a selection.
How Filtering Works
Filters work through the URL. When a user selects a filter value, that choice is added to the URL as a parameter. Every widget on the page can read that parameter and show only the matching data.
- User picks a filter value → the URL updates automatically
- Widgets read the URL → they show only data matching the filter
One selection controls many widgets at the same time.
The Two Filter Types
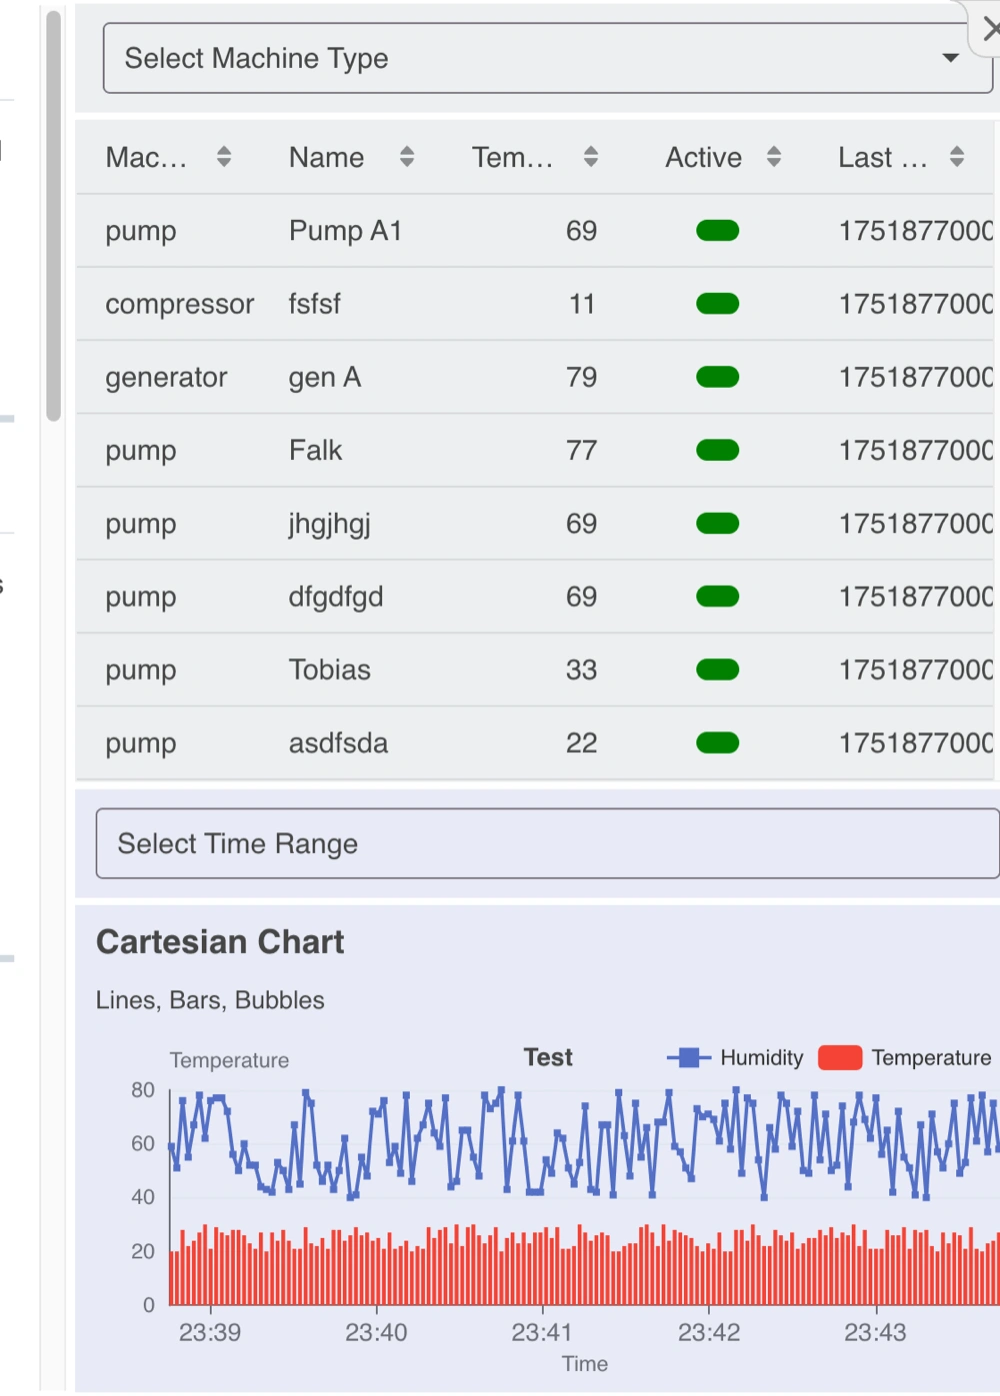
Filter Dropdown
Perfect for categorical data — locations, statuses, machine types, or any predefined list of options.
Example uses:
- Filter by location (Berlin, London, Tokyo)
- Filter by status (Active, Inactive)
- Filter by product category
Filter Calendar
Perfect for time-based data — specific dates, timestamps, or date ranges.
Example uses:
- Show data from the last 7 days
- View sensor readings for a specific month
- Filter logs by a custom date and time range
Configuring a Filter Widget
When you add a filter widget to your board, the key thing to set is the Parameter Key — this is the name that other widgets use to identify this filter.
Example: You create a Filter Dropdown listing Apple, Banana, and Orange, and set the Parameter Key to fruit. When a user selects Apple, the URL contains ...?fruit=apple. Any widget configured to use the fruit filter then shows only data where the fruit column equals apple.
For a Filter Calendar:
- Set just a Start Time parameter key to let users pick a single timestamp.
- Set both a Start Time and End Time parameter key to let users pick a date range.
Connecting Widgets to Filters
Filter widgets don’t talk directly to other widgets — they update the URL, and other widgets read from it. To connect a widget to a filter, open that widget’s settings and select which filter parameter key it should respond to.
You can have multiple filter widgets on the same page with different parameter keys. Each widget independently chooses which filters to apply — for example, a chart might respond to both the location filter and the date range filter, while a summary value tile responds to the date range only.
Clearing Filters
Users can always reset a filter to see all data:
- Dropdown — Select the blank ”---” option at the top of the list
- Calendar — Clear the date input field
When a filter is cleared, its parameter is removed from the URL and connected widgets return to showing unfiltered data.
Why This Matters
With filter widgets your board becomes interactive and user-driven. Users can explore data on their own terms — drilling down from a project-wide overview to a specific location, time window, or machine type — all through simple dropdowns and date pickers. No backend changes required.