MTConnect Collector
Connect CNC machine tools and shop-floor equipment that speak the open MTConnect standard, and get machine state, axis position, spindle and feed, alarms and tool data flowing without custom integration. Configure your machines and the data fields you want, and the app collects them at regular intervals and stores the results in the time-series tables of your project database — ready to query and inspect. See mtconnect.org to learn more about the protocol.
Why this app
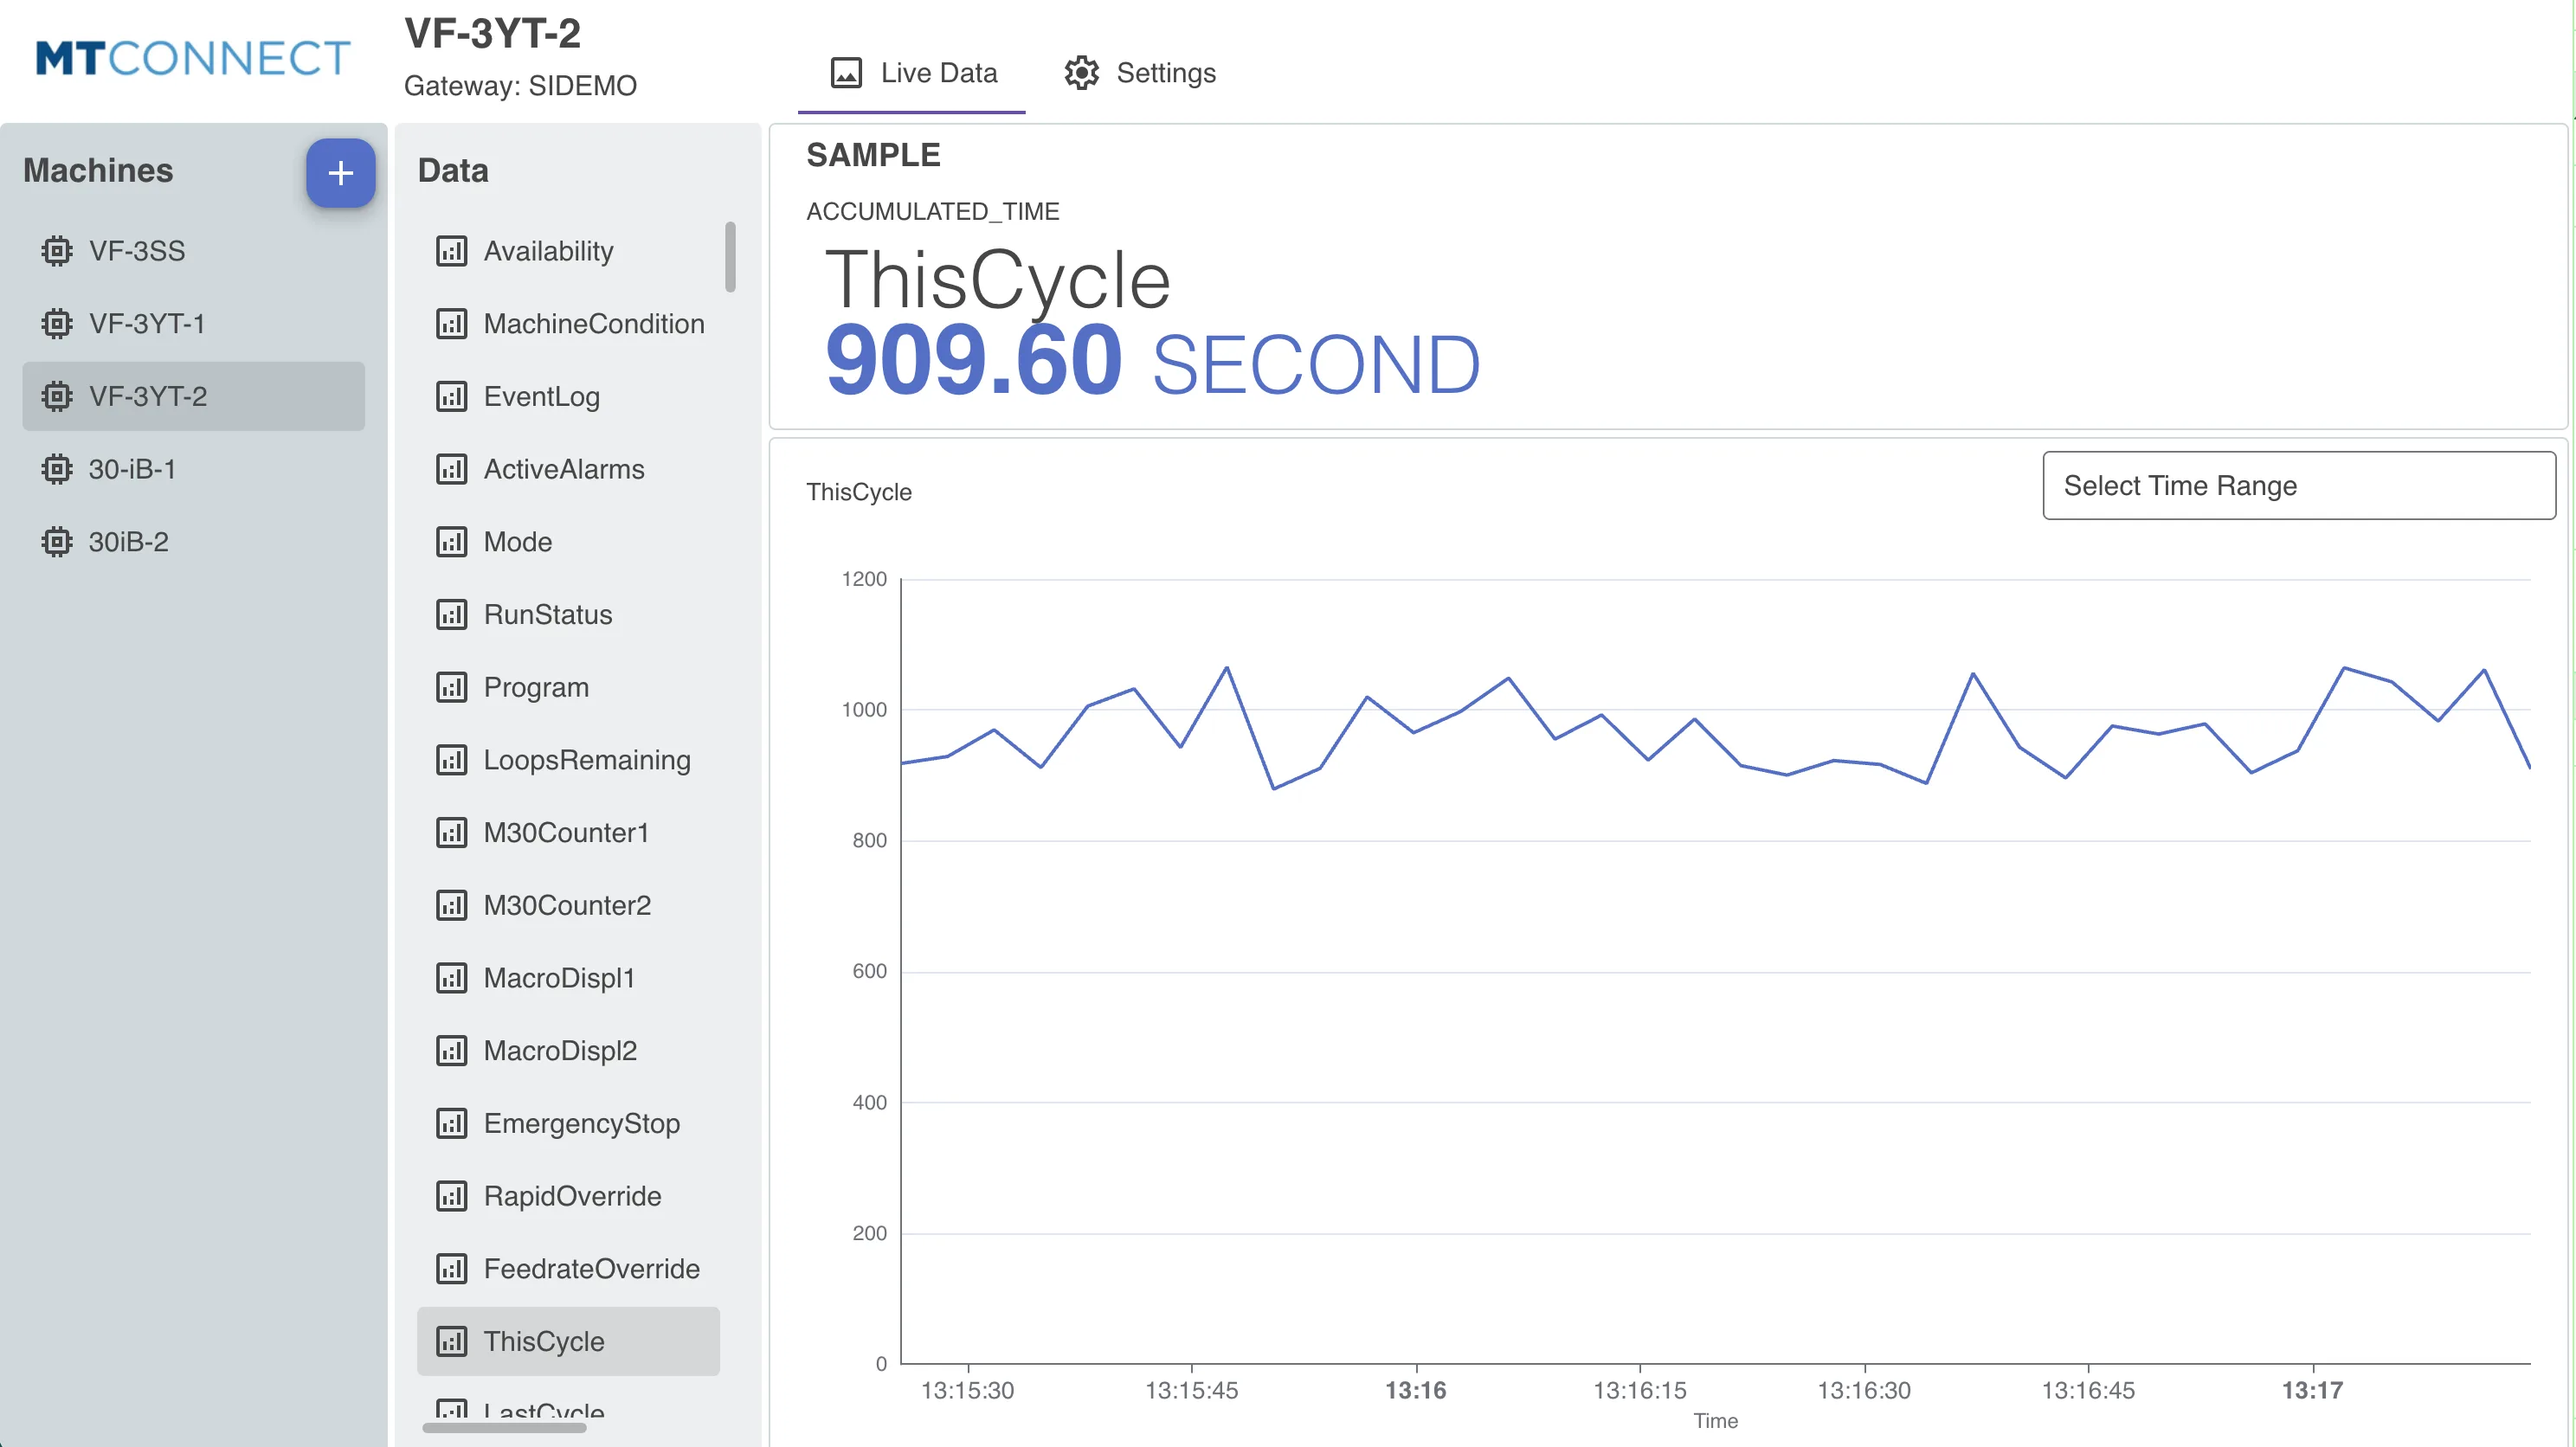
Zero-configuration discovery. By default the app extracts all available data from a machine at regular intervals as a JSON object — no field-by-field setup. Click any incoming data item to inspect it and find its data item id.
Collect only what you need. To narrow it down, enter the data item ids as a comma-separated list in the machine settings. You can find these ids by pointing a browser on the same network at your MTConnect server URL with the /probe suffix appended — the server returns an XML document; look for <DataItem id="my-data-item-id" ...> tags and use the listed ids.
Rich, self-describing readings. Because MTConnect is self-describing, every reading carries its name, units, category, type, native units and any text value — so the data arrives meaningful, not as anonymous numbers.
Built for machine utilization. State, mode, execution, alarms and tool data make the MTConnect Collector a natural foundation for OEE and machine-utilization dashboards across a shop floor.
Supported machines & protocol
The collector reads from any equipment that exposes an MTConnect agent — machine tools, presses, assembly machines and more.
Protocol details
- Standard: MTConnect (ASME B5.59), an open, XML/JSON, HTTP-based standard for machine-tool and shop-floor connectivity.
- Discovery: the agent’s
/probedocument describes every available data item; the app reads the/currentstream to collect values. - Default port: 5000 (configurable per machine), e.g.
http://<machine-ip>:5000/probe. - Data-item categories:
- SAMPLE — continuous or periodic measurements (temperature, position, spindle speed, feedrate, power…).
- EVENT — state changes (mode transitions, program/block, tool changes, controller state…).
- CONDITION — multi-state conditions (normal / warning / fault).
Machine tool builders & controls
MTConnect is supported (natively or via an agent/adapter) across the major CNC ecosystems, including:
- HAAS — mills, lathes and turning centers (the app ships with HAAS sample data for demo mode).
- Mazak — turning centers and multi-tasking machines.
- DMG Mori — machining and turning centers.
- Fanuc — CNC controls (via MTConnect agent/adapter).
- Okuma — CNC mills and lathes.
- Siemens Sinumerik and Heidenhain controls (via MTConnect agent).
- Any other machine or equipment exposing an MTConnect agent.
What you get
Install the app in your project and assign edge PCs (gateways) to it. You can then add MTConnect machines on the local network of each attached edge PC. Once started, the app collects every variable you specified (or all of them by default) and stores it in the MTConnect Collector / measurements table in your fleet database — ready to query, visualize and share.
Common collector features
Like every IronFlock collector, the MTConnect Collector is configured in the browser — add machines and pick data items in the built-in app board, no config files required. It is reliable at the edge: if the gateway loses its connection to the platform, the app keeps collecting from your machines and buffers the readings locally, then forwards everything in order as soon as the link returns — so a network outage never leaves a gap in your data (buffer size configurable per gateway). And you can try it without hardware: demo mode generates realistic HAAS sample data so you can explore the full experience before connecting a real machine.
Build on your data
The app includes a built-in dashboard showing current values and historical line charts. For more advanced needs, build custom dashboards and SCADA boards on the MTConnect Collector / measurements table, query the data through the Data Backend, and use the Alarms app to monitor collected KPIs in real time with SMS or email notifications. To bring devices online and install the app, see Device Management and App Management.