Build Your First App
This guide walks through the typical workflow for building an IronFlock app that collects data from edge devices and displays it on real-time dashboards. By the end you will have a data model, edge logic, a user-facing configuration form, and live charts — all connected through the project database.
1. Design the Data Model
Start in the .ironflock/data-template.yml file. Think about two categories of tables:
- Entity tables — track the current state of things (devices, machines, connections). Rows are appended on every change;
maintainLatestFlagForkeeps the newest entry marked. - Time-series tables — collect measurements over time (sensor readings, metrics). Every row is a new data point with a timestamp.
data:
  tables:
    # Entity table: one row per device, latest state always queryable
    - tablename: devices
      maintainLatestFlagFor: ['device_key']
      columns:
        - id: tsp
          dataType: timestamp
        - id: device_key
          dataType: string
        - id: status
          dataType: string
        - id: device_name
          dataType: string
        - id: deleted
          dataType: boolean

    # Entity table: user-configured Modbus servers
    - tablename: modbus_servers
      maintainLatestFlagFor: ['server_id']
      columns:
        - id: tsp
          dataType: timestamp
        - id: server_id
          dataType: string
        - id: host
          dataType: string
        - id: port
          dataType: numeric
        - id: deleted
          dataType: boolean

    # Time-series table: periodic readings from connected hardware
    - tablename: readings
      columns:
        - id: tsp
          dataType: timestamp
        - id: server_id
          dataType: string
        - id: metric
          dataType: string
        - id: value
          dataType: numeric
2. Set Up a Test Environment
To test your app you need a dev environment in a project with at least one online device:
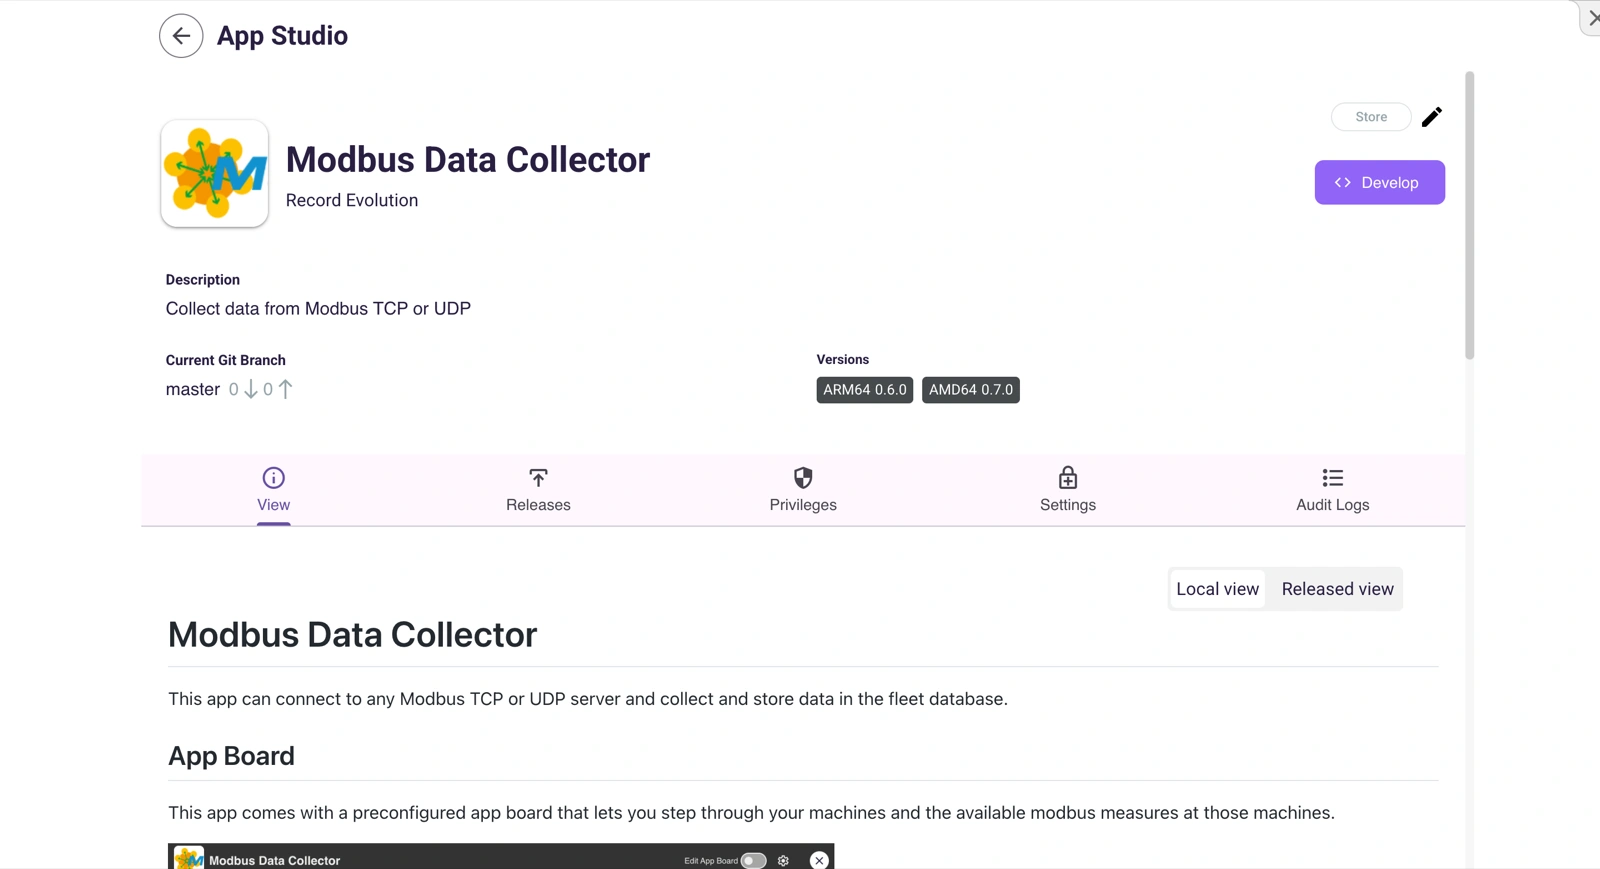
- Click Develop on the app detail page to open the Cloud IDE.
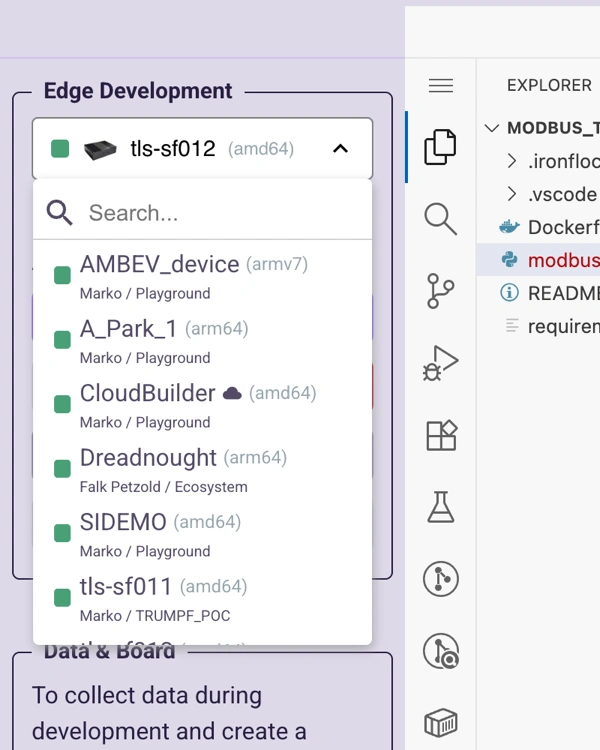
- Pick an online device from any project you have access to.
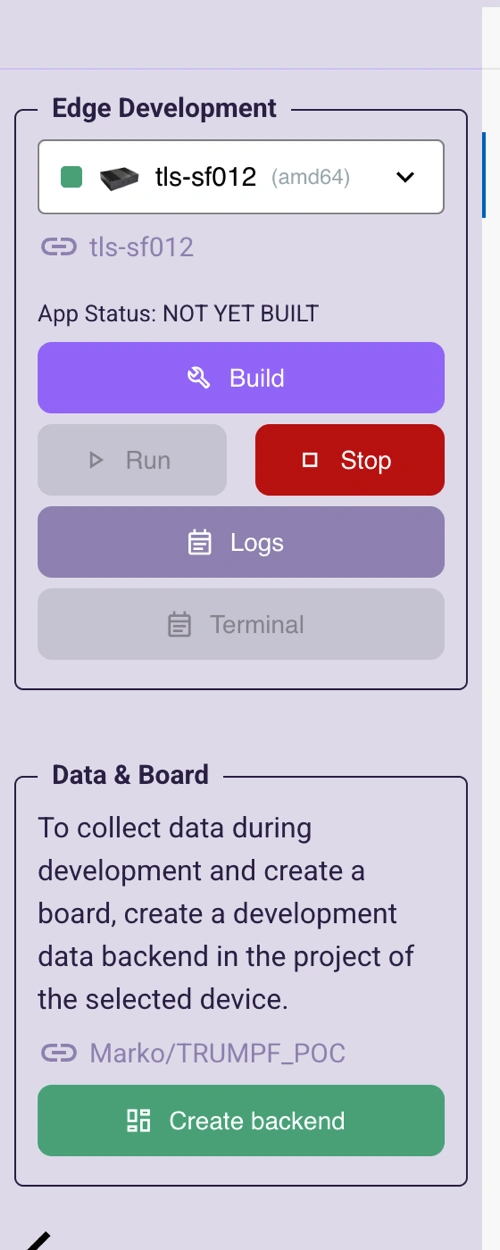
- Click Create Backend in the side panel to create a dev environment in that project’s database.
This instantiates the tables defined in your data-template.yml inside the project’s database. You can inspect them in the project’s Fleet Database view.
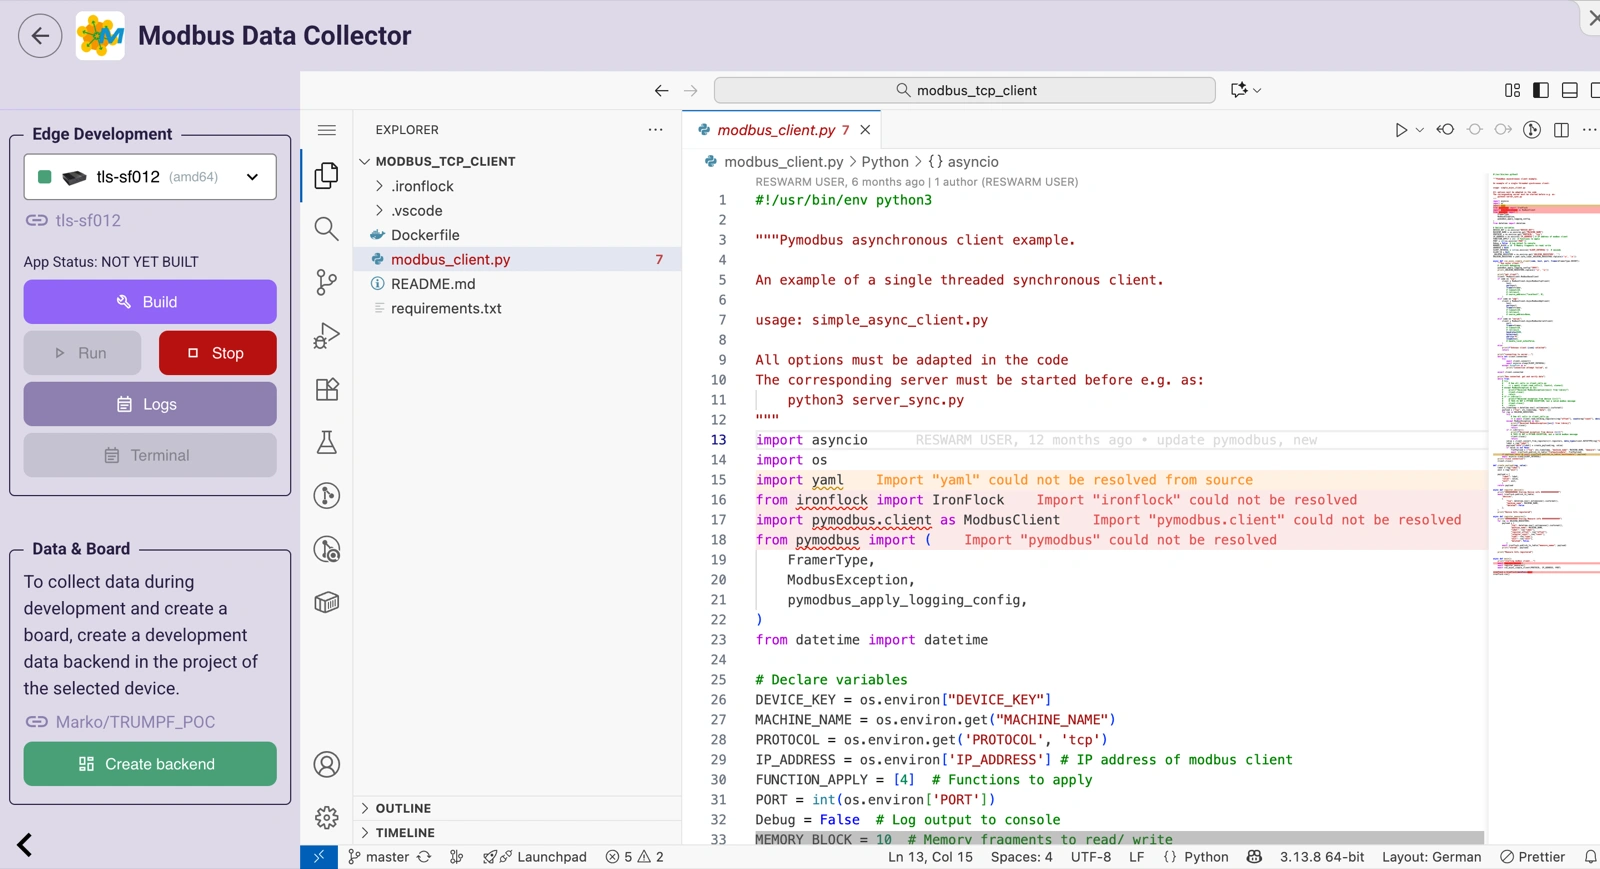
The Cloud IDE gives you a full VS Code environment with a file explorer, editor, terminal, and the Edge Development panel for building and deploying to your device.
3. Write the Edge Code
Your Docker container runs on the device and uses the IronFlock SDK to interact with the project database.
Register the device on startup
When the edge component starts, append a row to the devices entity table so the dashboard knows the device is online:
Python
import asyncio
from ironflock import IronFlock

async def main():
    # Register this device as online
    await flock.append_to_table("devices", {
        "device_key": os.environ.get('DEVICE_KEY'),
        "tsp": now,
        "status": "online",
        "device_name": os.environ.get('DEVICE_NAME'),
        "deleted": False
    })

    # ... rest of your logic

flock = IronFlock(mainFunc=main)
flock.run()Because devices uses maintainLatestFlagFor: ['device_key'], the previous status row for this device is automatically superseded. Widgets that filter by latest_flag = true always show the current state.
React to user configuration
Users can add Modbus servers through a form on the board (see step 4). Your edge code subscribes to the modbus_servers table and acts on new entries:
Python
async def main():
    # ... device registration ...

    # Read existing Modbus servers
    existing = await flock.getHistory("modbus_servers", {
        "limit": 1000,
        "filterAnd": [
            {"column": "latest_flag", "operator": "=", "value": True},
            {"column": "deleted", "operator": "IS", "value": None}
        ]
    })
    for server in existing:
        create_modbus_connection(server)

    # React to new servers in real time
    def on_server_change(*args, **kwargs):
        server = args[0] if args else kwargs
        if server.get("deleted"):
            delete_modbus_connection(server["server_id"])
        else:
            create_modbus_connection(server)

await flock.subscribe_to_table("modbus_servers", on_server_change)Collect time-series data
Once a Modbus connection is established, poll periodically and write the readings to the readings table:
Python
async def modbus_poll_loop(server_id, client):
    while True:
        values = client.read_registers()
        for metric, value in values.items():
            await flock.publish_to_table("readings", {
                "server_id": server_id,
                "metric": metric,
                "value": value
            })
await asyncio.sleep(5)4. Build the Board
Open the Board Editor and add widgets that connect to your Data Backend tables.
Show device status
Add a Table widget connected to the devices table. Filter by latest_flag = true so it always shows the current state of each device. The table updates automatically when a device comes online or goes offline.
Let users configure Modbus servers
Add a Form widget connected to the modbus_servers table. Configure fields for host and port. When a user fills in the form and submits, a new row is inserted into the modbus_servers table automatically — no backend code needed to handle the form submission.
Your edge code picks up the new row via subscribeToTable (see step 3) and establishes the Modbus connection.
Visualise time-series data
Add a Line Chart widget connected to the readings table. Map tsp to the X-axis and value to the Y-axis. The chart updates in real time as new readings arrive from the devices — no polling or manual refresh required.
How It All Fits Together
┌─────────────────────────────────────────────────────────┐
│  Board (Dashboard)                                      │
│  ┌──────────┐  ┌──────────────┐  ┌───────────────────┐  │
│  │ Table    │  │ Form            │  │ Line Chart     │  │
│  │ devices  │  │ modbus_servers  │  │ readings       │  │
│  └────┬─────┘  └──────┬───────┘  └────────┬──────────┘  │
│       │               │                   │             │
└───────┼───────────────┼───────────────────┼─────────────┘
        │               │                   │
   ┌────▼───────────────▼───────────────────▼────┐
   │           Project Database                  │
   │  devices  │  modbus_servers  │  readings    │
   └────▲───────────────▲───────────────────▲────┘
        │               │                   │
   ┌────┴───────────────┴───────────────────┴────┐
   │           Edge Code (on device)             │
   │  register device → read config → poll data  │
   └─────────────────────────────────────────────┘
The project database is the single source of truth. The edge code writes to it, the board reads from it in real time, and user actions via forms write back into it. Your edge code can subscribe to those changes to close the loop — no custom API endpoints needed.
Tips
- Start with entity tables. Get device registration and a status table working before adding time-series collection.
- Use
maintainLatestFlagForon any table where you need to query current state. It lets you append history and query the latest row without extra code. - Add a
deletedcolumn to entity tables that users manage through forms, so records can be soft-deleted while preserving history. - Use
appendToTablefor writes that need confirmation (e.g. initial device registration). UsepublishToTablefor high-frequency telemetry where fire-and-forget is acceptable. - Keep time-series tables simple. One timestamp, an identifier for the source, and the measured values. Use transform tables for aggregation.
Next Steps
If your hardware exposes a web-based HMI or configuration interface, you can embed it directly into your IronFlock board using the Embed widget and device tunnels. See Embedding External HMIs for details.