Split Charts
Split Charts automatically create multiple charts from your data — no manual setup required. Configure a chart widget once, pick a column to split by, and IronFlock generates one chart per unique value in that column.
How It Works
- Open a chart widget in edit mode.
- Find the Split Column setting in the dataseries configuration.
- Select the column whose unique values should each get their own chart.
- Save — the board renders a separate chart for every group automatically.
New values in that column? A new chart appears instantly, with no changes needed on your end.
Live Example
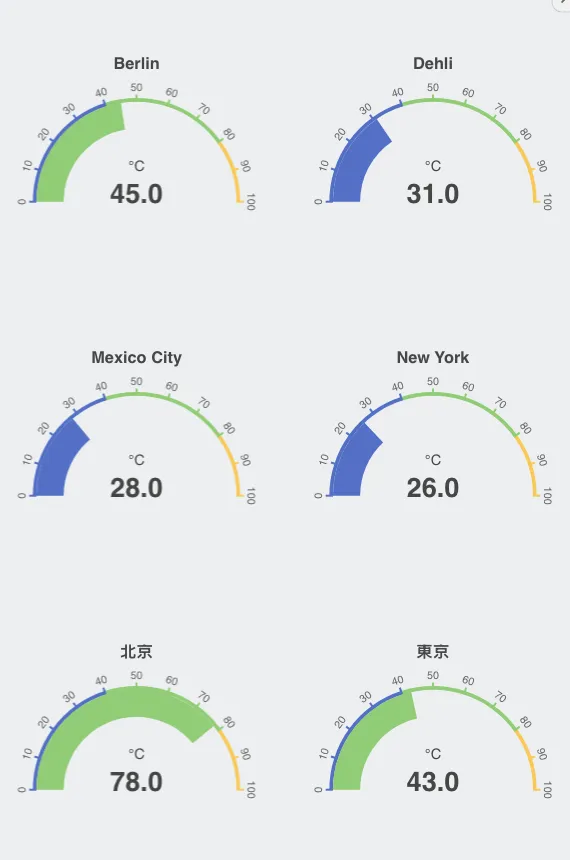
Example: Temperature by City
Imagine your device sends a table with three columns: timestamp, temperature, and city.
Set the Split Column to city. The board automatically generates:
- A line chart for Frankfurt
- A line chart for Berlin
- A chart for every other city that appears in the data
| Timestamp | Temperature | City |
|---|---|---|
| 08:00 | 18 | Frankfurt |
| 09:00 | 19 | Frankfurt |
| 08:00 | 16 | Berlin |
| 09:00 | 17 | Berlin |
No duplicated widget definitions. No manual updates when a new city shows up.
Why Use Split Charts
- Saves time — configure once instead of creating one widget per entity.
- Scales automatically — new sensor, machine, or location? New chart appears on its own.
- Keeps dashboards clean — one compact configuration, dynamic output.
Great for visualizing fleets of devices, sensor networks, or any dataset grouped by a category.
Last updated on