Data Binding
Data binding is the bridge between your project database and the widgets on your IoT board. Almost every configurable property of a widget — titles, values, colors, chart series, gauge ranges — can be dynamically driven by live data coming from your project’s TimescaleDB. This page explains how to connect table columns to widget properties and how to refine the data with filters.
For a broader look at how data gets into the project database, see the Data Handling overview.
The Two Ways to Bind Data
There are two fundamental binding modes in IronFlock’s Board Studio:
- Value references — bind a single scalar value (the latest record of a column) to a widget property.
- Table references — bind an entire result set (multiple rows) to a widget property that expects an array.
Both modes support filtering and both provide real-time updates: as new rows arrive in the project database, bound widget properties automatically refresh without any polling.
Value References
Most widget configuration fields expect a single value — a title, a numeric reading, a color, a status label. Under these fields in the widget editor you will find a small data binding switch.
When you activate the switch, clicking the field opens a dropdown that lists all the data available in your project database. You can:
- Pick a table from the project database.
- Choose a column within that table to bind to the property.
Example: You can bind the title field of a gauge widget to the name column in a machine table, or bind the value field of a number widget to the latest temperature reading from a sensor_data table.
The Newest Value
A value reference always delivers the newest single value for the selected column. “Newest” is determined by the mandatory tsp column — every table in the project database has a tsp timestamp column, and the row with the largest tsp wins.
Filter Icon
Once you have bound a column to a widget property, a small filter icon appears next to the data switch beneath the field. Clicking this icon opens a dialog where you can configure filters that narrow down the rows considered when extracting the value. See Filter Configuration below.
Table References
Some widgets expect an array of values rather than a single scalar. A chart widget, for example, needs many (x, y) points to draw a line; a table widget needs many rows.
In these places, the widget editor shows an Add button (to append array items manually) alongside a data binding switch next to the field label.
- Manual mode: Click Add to append items one by one with static values.
- Data binding mode: Flip the switch to bind the array to a table. Select the table and each qualifying row becomes one array item.
You can use the filter icon next to the data switch to narrow down the returned rows to exactly what you need — see Filter Configuration.
Mapping Columns to Array Item Fields
Once data binding is active for a table reference, you configure a single array-item template using values from the connected table. For a line chart, the array items need x and y values — you make both data driven by picking the columns from the bound table that should feed each axis. Every row in the filtered result set is then rendered into the chart using that mapping.
The same pattern applies to any widget that accepts arrays: bar charts, tables, lists, heatmaps, and more.
Filter Configuration
Filters let you narrow down the rows used for a value reference or table reference. A filter dialog has three sections, all of which are combined with logical AND in the order shown:
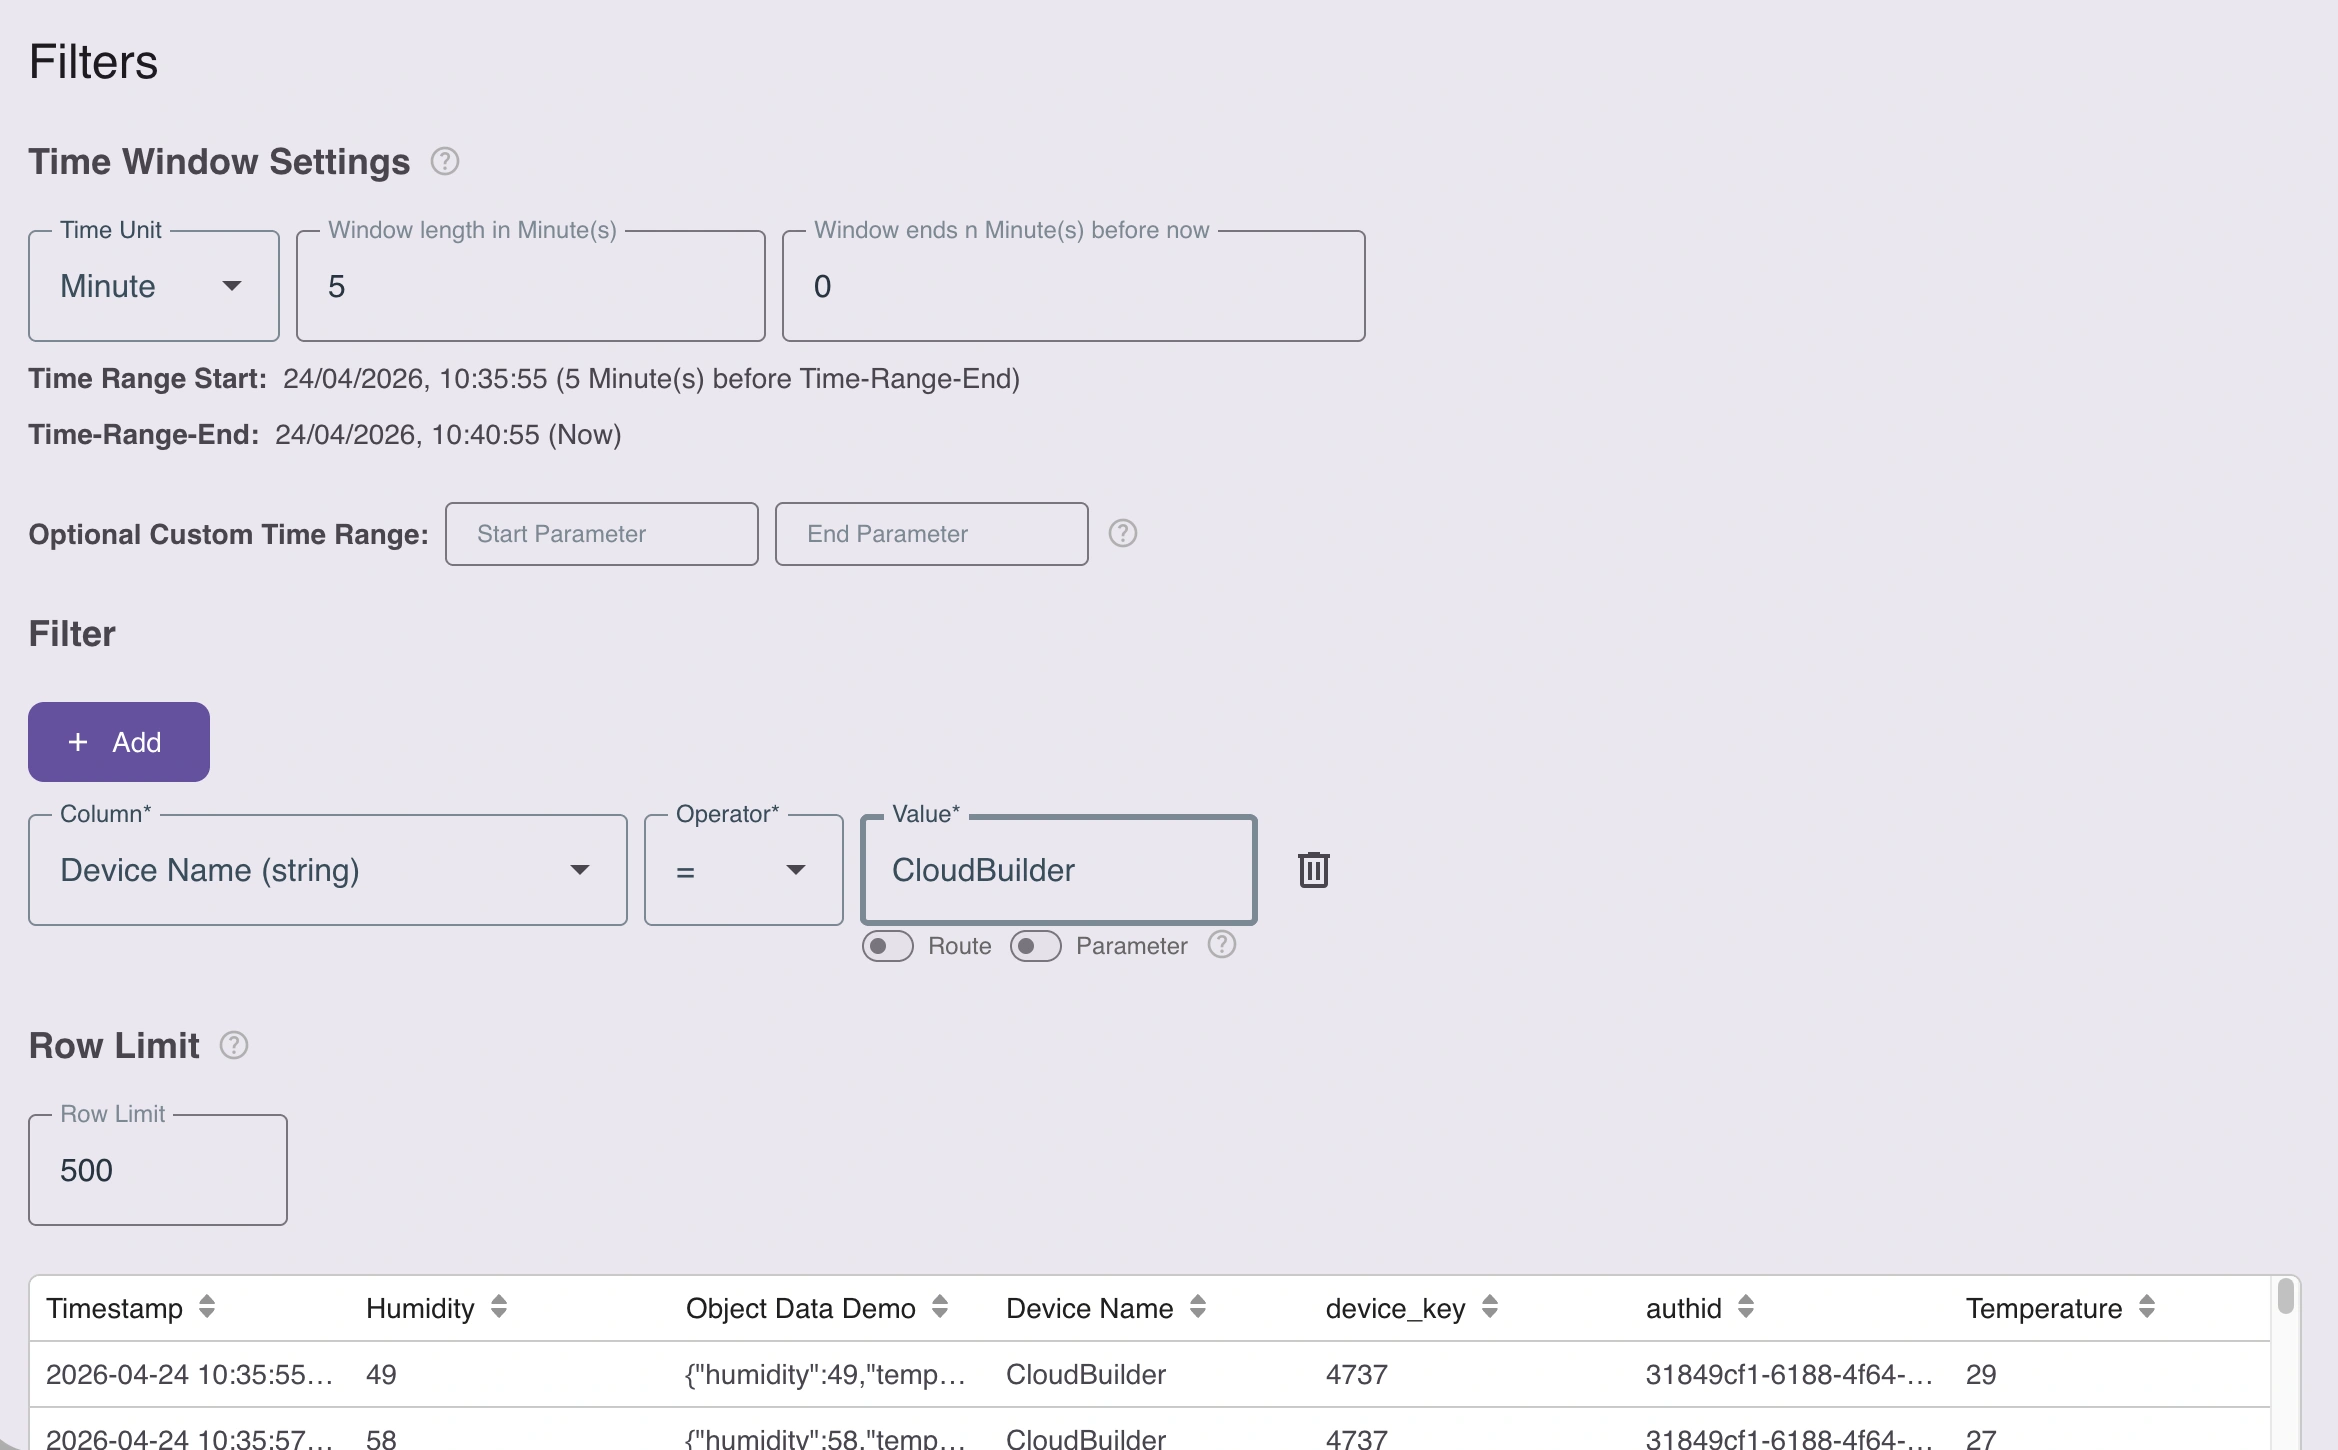
1. Time-Window Settings
Configure how records are filtered by time:
- Rolling window — show only rows from the last N minutes, hours, days, etc. relative to now.
- Custom time window — specify the names of a start parameter and an end parameter. These parameter names are supplied at runtime by a Calendar Widget, which lets the end user pick a date range on the board.
2. Arbitrary Column Filters
Add any number of column-level filters using one of these value sources:
- Constant values — hard-coded values (e.g.,
status = 'active'). - Filter parameters — values supplied by a Filter Widget through the URL.
- Routing path segments — values extracted from the current page URL via Navigation Widgets.
3. Row Limit
Set an upper bound on the number of rows returned for the widget. The limit cannot exceed 3000 — this cap protects both your browser and the project database from oversized result sets.
All three sections compose together: the time window narrows the time range, column filters refine the rows further, and the row limit caps the final output.
Selecting Fields from JSON Columns
The project database supports JSON columns for unstructured or semi-structured data (device telemetry payloads, configuration blobs, nested records).
When you bind a JSON column to a widget property, an additional input appears that lets you specify the path to a leaf field within the JSON structure. The path uses standard JavaScript object notation:
sensor.temperature
payload.items.0.value
metadata.location.city
The widget then extracts the value at that path from each record. This works for both value references (the newest JSON record’s extracted leaf) and table references (the extracted leaf from every row).
Summary
- Use value references for scalar properties (title, value, color) — you get the newest value by
tsp. - Use table references for array properties (chart series, tables, lists) — you map columns to array-item fields.
- Use the filter dialog to refine rows with time windows, column filters, and a row limit (max 3000).
- Use JSON path notation to drill into unstructured JSON columns.